VoIP: fundamentals of SIP and related topics - part #5: the main tools for working with VoIP

Here we are, close to the end of this mini-series.
In the previous episode I talked about the UA PBX, standard configurations and some security tips.
In this episode I'll talk about the main tools to analyze VoIP issues:
- whireshark / tshark
- sngrep
- homer
Whireshark / tshark

Quoting from the official website :
Wireshark is the world’s foremost and widely-used network protocol analyzer. It lets you see what’s happening on your network at a microscopic level and is the de facto (and often de jure) standard across many commercial and non-profit enterprises, government agencies, and educational institutions. Wireshark development thrives thanks to the volunteer contributions of networking experts around the globe and is the continuation of a project started by Gerald Combs in 1998.
On the official website and in general on the internet you will find many tutorials to work to the maximum potential with this special tool.
I will now give you some quick examples (with some screenshots) of using this tool:
open the whireshark program and choose, in the main screen, which interface you want to analyze. I choose my wifi interface

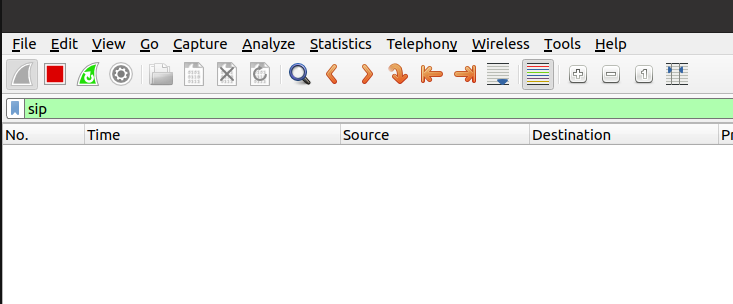
Now you'll start to see the flow of all the packages flowing through your interface. We set the filter suitable for our purpose: we choose to monitor only SIP packets. It's very easy, just go to the "Apply a display filter" bar and type SIP
now let's try to make a SIP call from our client and see what happens in whireshark.
And voilà, here are all the SIP packets of the call.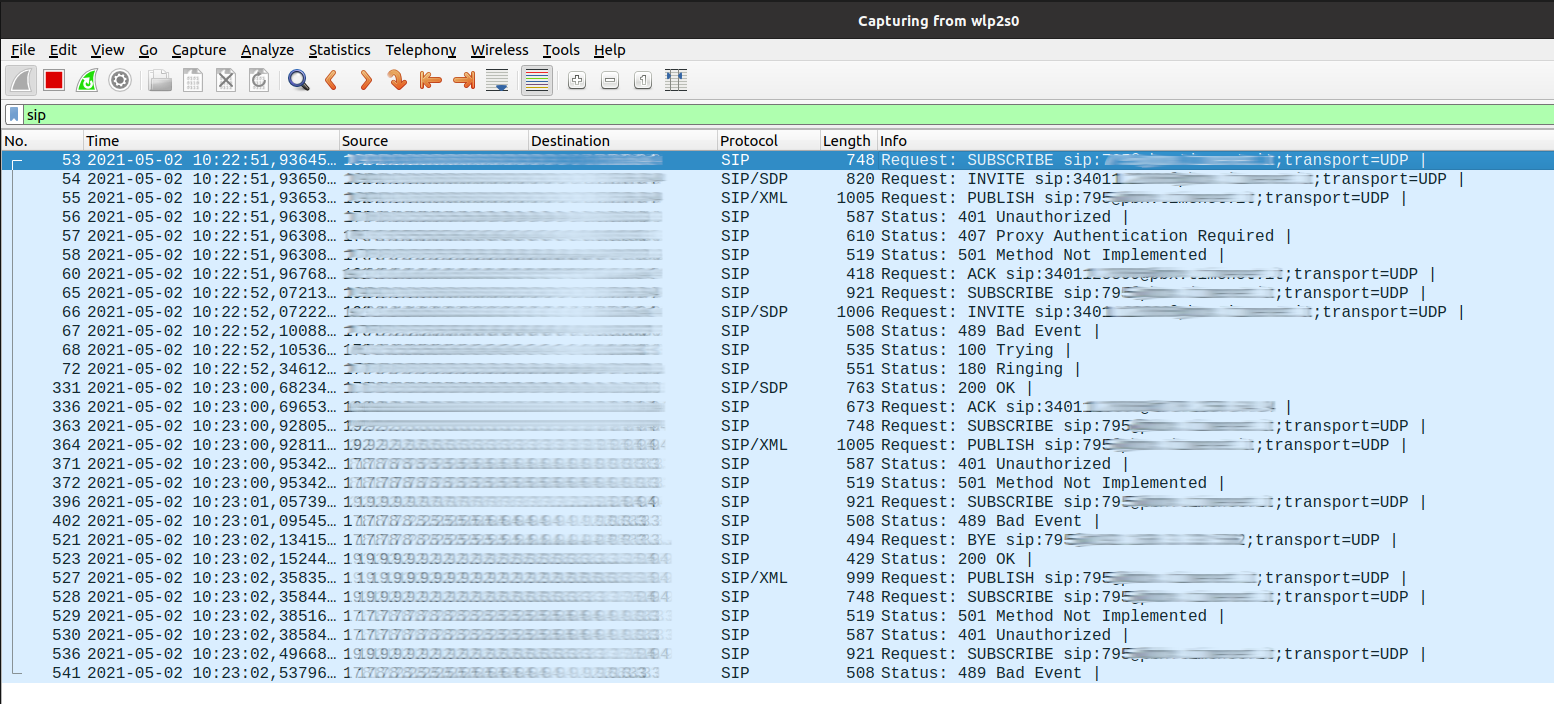 You can double-click on every package to enter in detail mode and see all the details of the layers of the particular packet
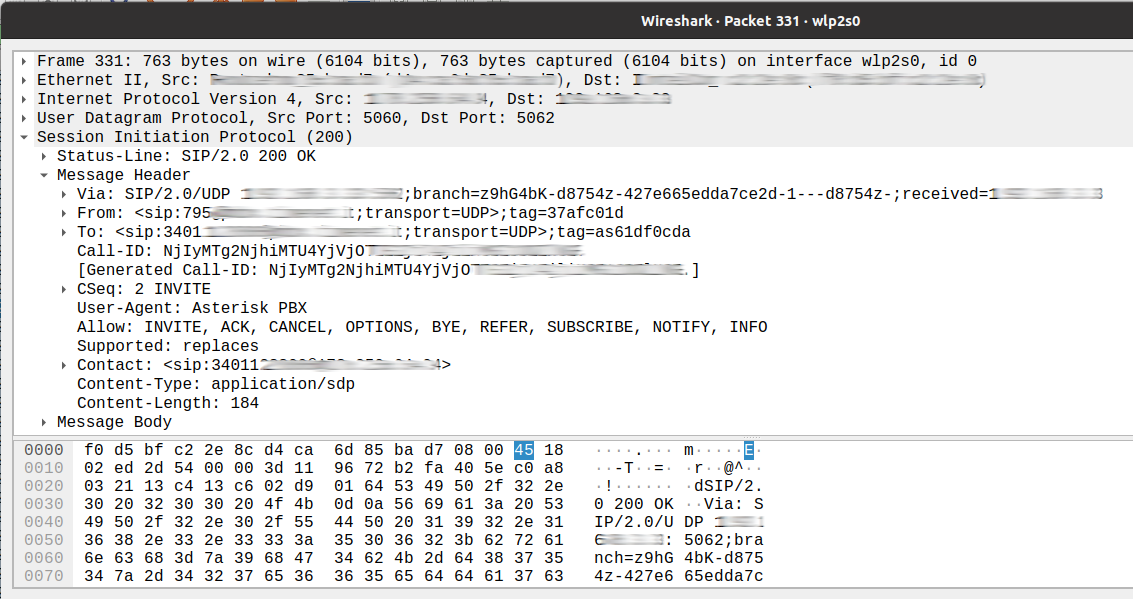
There is an interest section for the VoIP troubleshooting, the Telephony menu; here you can find:
- the VoIP Calls menu
 with the
 Flow sequenceview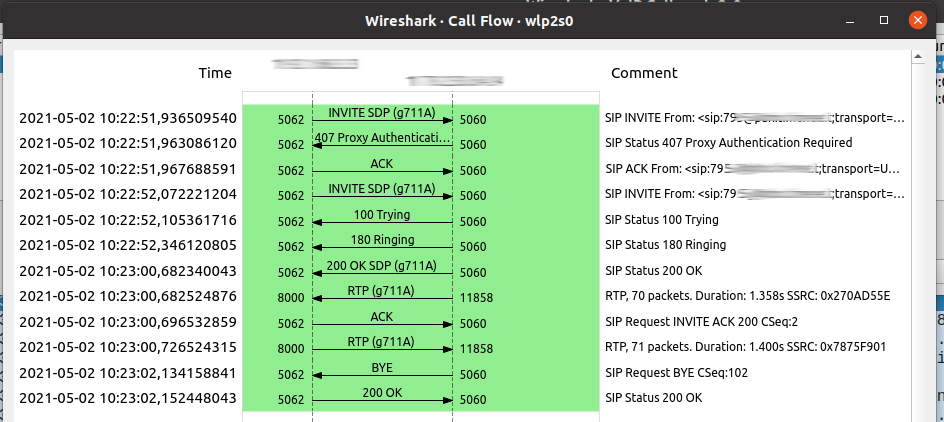
- the RTP/RTSP menu, to analize the MOS and quality of stream
and so on.
The (very small) limitation of this tool is that if I have to do a realtime analysis on a remote server (which has no graphical environment), I will first have to make a capture with tshark, download the pcap file on my PC and then open the file with wireshark to analyze it thoroughly
Tshark is a network protocol analyzer as wireshark. Is more or less the same tool, but it has no GUI, you drive it from the shell. It is therefore very convenient for servers that do not have a graphical environment.
As you can see the result of capture is the same, but in shell
 An interest option of tshark is
 -w
If the -w option is specified when capturing packets or reading from a capture file, TShark does not display packets on the standard output. Instead, it writes the packets to a capture file with the name specified by the -w option.
So the typical use I make of the tshark + wireshark combo is:
- I launch tshark with
-won the remote server where I have to troubleshoot - when I have captured what I need I interrupt tshark
- I download the pcap locally
- and at this point I open the pcap file with whireshark and proceed to an in-depth analysis of the problem
Sngrep
sngrep is a useful tool for displaying SIP call message flows. It supports live capture to display realtime SIP packets and can also be used as PCAP viewer. sngrep supports UDP, TCP and TLS.
I don't dwell on how to install the tool, there is a lot of material on the net; here are some links:
- https://support.simwood.com/hc/en-us/articles/223811708-Packet-Capturing-sngrep
- http://sipxcom.org/get-to-know-sngrep/
It is very useful when you need to make realtime captures on servers without a graphical environment. Sngrep graphics are very intuitive, its strength is to show the flow of SIP messages in visual form.
When you run sngrep, you star to see the list of calls

Then you can decide to enter in the details of a specific call to see all the packets

With sngrep you can also filter and save in pcap format (so it could be an alternative to tshark to capture calls and then analyze in depth with wireshark)
Thanks to Alex Lane for the images
Homer

Homer from Sipcapture is a magnificent tool that Change the way you Analyze RTC and Debug VoIP Services.
HOMER is part of the SIPCAPTURE stack: A robust, carrier-grade and modular VoIP and RTC Capture Framework for Analysis and Monitoring with native support for all major OSS Voice platforms and vendor-agnostic Capture agents.
With Homer there is no need to activate a capture in realtime as much as your client has a problem, with Homer you have all the call flows ready to use and accessible from a very usable dashboard.
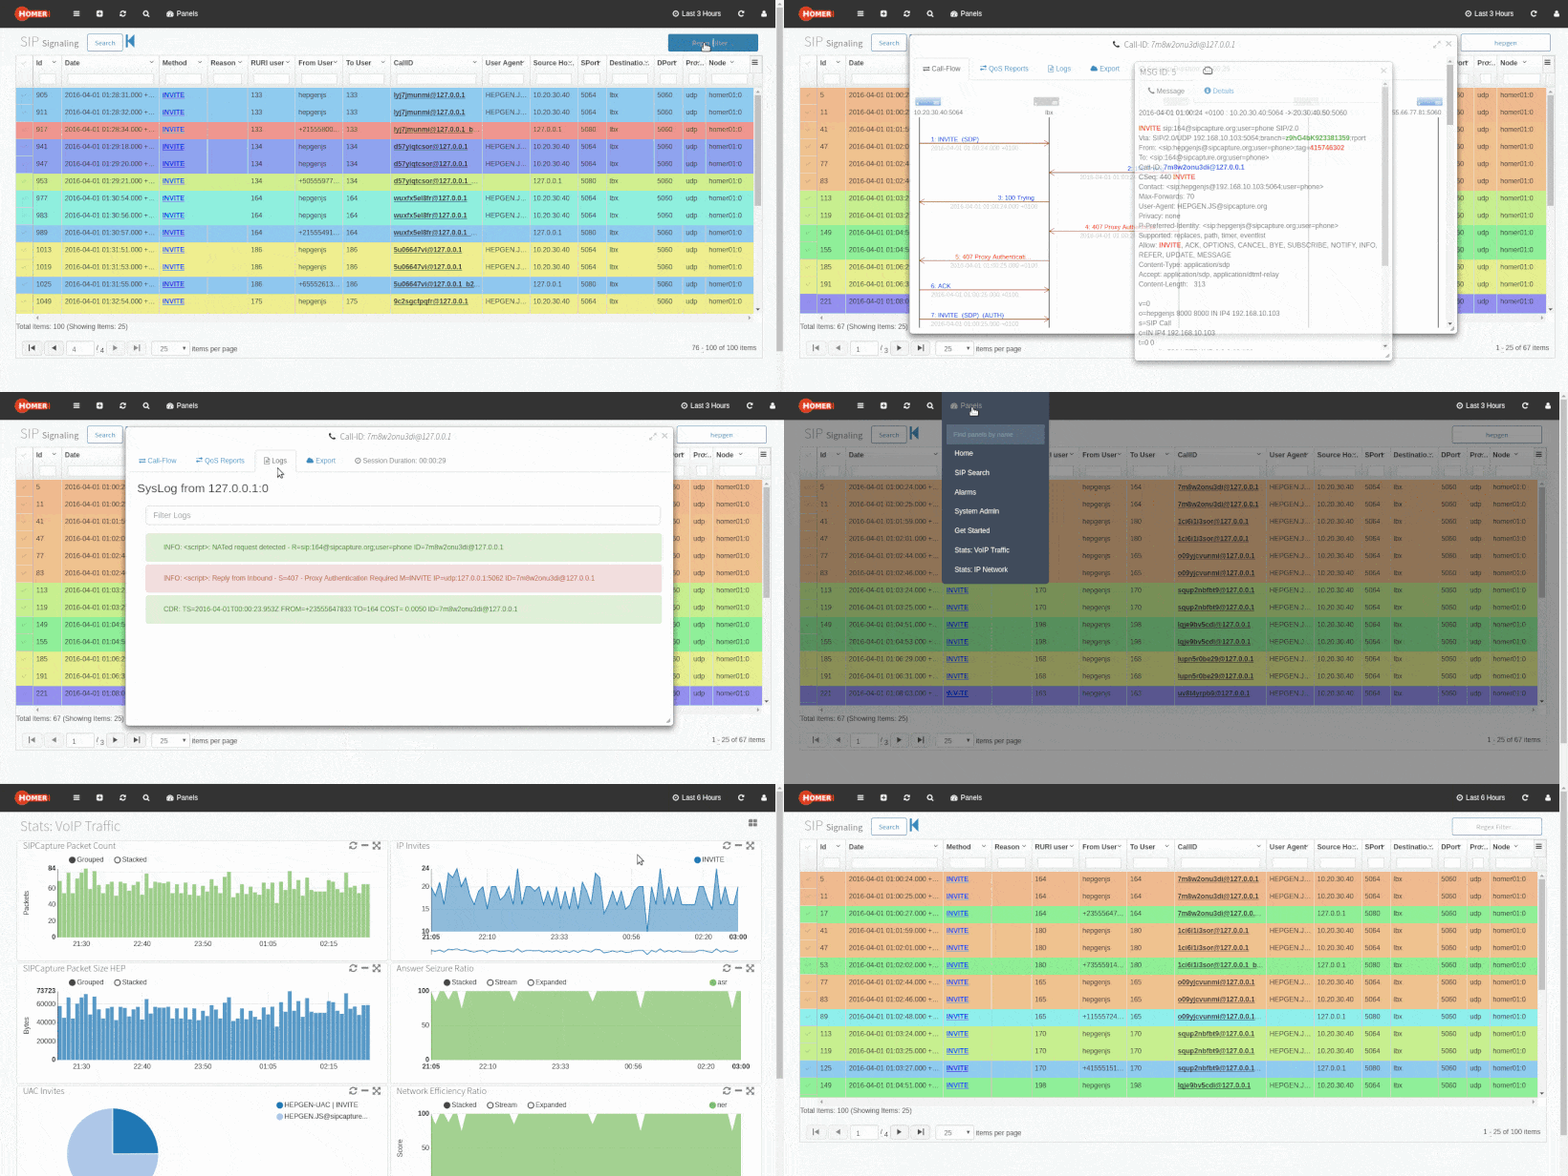
The Homer ecosystem is composed, simplistically speaking, of a capture server and a capture agent.
The agent runs on your VoIP network, captures packets and sends them to the server. The server stores them and makes them usable.
On sipcapture website you will find a lot of more precise details.
I want to conclude with a thought that I have accrued in my experience as a problem solver:
never skip any of the 4 phases:
symptom collection: interview the customer who reports the problem to you with targeted questions; collect the symptoms and discard the hypotheses of diagnosis that the client brings you.
When a sick person goes to the doctor, the doctor holds the parts like "I have acute pain here. I ate this yesterday. Every time I do this movement I feel sick. It had already happened to me", and discards phrases like "I think I have indigestion ".
The diagnosis is up to you and not by your client.anamnesis: after the client has explained the symptoms to you, collect all the important information that can help you with the diagnosis that you will have to make in the next phase; try to reduce the variablesdiagnosis / analysis: with the list of symptoms and anamnesis combined with your experience, do the magic!resolution: implement the solution to solve the problem that the customer has reported to you. Then call your customer and explain to him, without all the details but with an exhaustive description, what you encountered and how you solved him.
when you approach a problem, do not discard the simplest reasons in favor of abstruse hypotheses, on the contrary, start from the simplest hypotheses. Usually when we open the problem that a customer reports to us, we immediately start off on the tangent and begin to hypothesize astral conjunctions, abstruse bugs or crazy hackers .. and then most of the time the problem is that the power plug is unplugged.
That’s all for this episode too. Let me know what you think about it.
Thanks a lot for reading, sharing and comment this article.
Thanks to undraw.co for the beautiful illustration I used in the header
Cheers!
We are quite close to the end of this mini-series, but I've some other surprise
To be continued …


